
So, if you’re a Texan, you already know who ERCOT is and you already know what’s going to happen in the next few days. If you’re not Texan, or you haven’t been eyeing the weather, it’s going to freeze. If you’re not sure what the connection to freezing weather and ERCOT, I’d recommend reading up on it here: Wikipedia This quick hack article isn’t about them per se, but something that might be helpful to keep an eye on the grid in the upcoming winter storm.
As someone that was affected by the 2021 Texas Snowpocalypse, aka the moment that Texas let us down, keeping an eye on the grid has been one thing I’ve done frequently since then. Coupled with the local power delivery company’s outage tracker, these two resources are invaluable for keeping aware of an ongoing crisis, or knowing the general state of affairs.
In this quick article, I’ll talk about a couple of API endpoints I found in ERCOT’s site that you can implement to keep an eye on things without having to refresh their page.
Ooooh pretty!
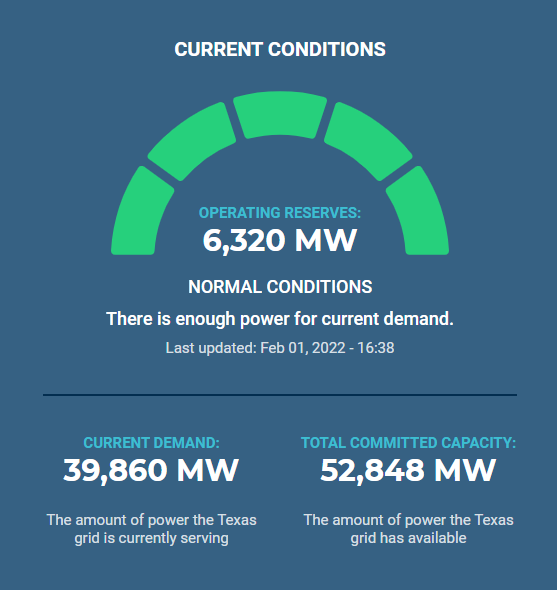
When you go to https://www.ercot.com you see a pretty webpage with information and details about the company, but that’s not really the point. If you were in Texas during Feb, 2021, you know who they are already. Instead, we’re focusing on this neat little widget. This tells us five things:
1: The current state of the grid expressed as a half-circle bargraph. This is telling us that there is more capacity (power being generated) than there is demand (power being used). If we go into an emergency status, this will be yellow, orange, or even red depending on the severity. The text and the link will also update outlining what the specific state means.
2: The numeric value for operating reserves expressed in megawatts (MW). This means that there is more capacity than production, lower numbers may constitute needing to implement conversation measures or in emergencies, load shedding to keep the grid healthy.
3: The current demand (load) on the grid expressed in megawatts (MW). This is how much power is being used by everyone connected to the grid.
4: The current committed capacity expressed in megawatts (MW).
This is how much power is committed to being generated (More on the “committed to” versus “actual” in a bit.
Behind the scenes….
Stripping away the pretty factor of the website and looking at its HTML source, it’s easily apparent that these numbers are being fed from an API and are then rendered in javascript which means a simple curl https://www.ercot.com is not going to be useful enough to get us numbers. Instead, we can query the actual API endpoints and fetch the .json files ourselves for parsing.
Endpoint 1: daily-prc.json
The first endpoint returns a JSON formatted output called daily-prc.json which appears to return several JSON objects, however we’re only interested in the first one for the quick observation. The first block is called current_condition and returns all the meaty details that we’re looking for.
$ curl -s -k https://www.ercot.com/api/1/services/read/dashboards/daily-prc.json | jq '.["current_condition"]'
{
  "condition_note": "There is enough power for current demand.",
  "eea_level": 0,
  "energy_level_value": 20,
  "state": "normal",
  "title": "Normal Conditions",
  "prc_value": "6,202",
  "index": 0,
  "datetime": 1643756580
}
We can break the current_condition object down using jq into relevant sub-items using the below syntax:
curl -s -k https://www.ercot.com/api/1/services/read/dashboards/daily-prc.json | jq '.["current_condition"]["prc_value"]'
"6,114"
At the exact moment in time that this command was executed, the current operating reserves was 6,114 MW.
A brief explanation of the fields in the current_condition object:condition_note: This is a one line status of the current condition.eea_level: This is the current energy emergency alert status. (0=OK, 1 = severe alert, 2= critical alert, 3 = imminent outages).energy_level_value: Not sure what this does yet.state: A keyword for the current operating status.title: Another text keyword for the current operating status.prc_value: The amount of power in MW in capacity reserves.index: I believe this is used by the javascript to render.datetime: The last measurement recorded by the API in Epoch time.
You could in theory download the entire daily-prc.json file at 11:45PM and be able to graph the entire day’s reserve capacity. You can read more about the different EEA levels here: https://www.ercot.com/files/docs/2021/06/11/2021_EEA_Overview_Final.pdf
Endpoint 2: todays-outlook.json
todays-outlook.json is interesting in that it’s both a forecast prediction of the current capacity and demand and a history of the capacity and demand for the date pulled. It’s segmented into a single JSON object called “data” with individual objects that are recorded every 5 minutes. It’s interesting because if you know when to query, you can get the current load and the current generating capacity are:
$ curl -s -k https://www.ercot.com/api/1/services/read/dashboards/todays-outlook.json | jq . | head -15
{
  "lastUpdated": "2022-02-01 17:25:01",
  "data": [
    {
      "capacity": 53358,
      "demand": 36309,
      "forecast": 0,
      "dstFlag": 0,
      "interval": 0,
      "hourEnding": 0
    },
    {
      "capacity": 53447,
      "demand": 36253,
      "forecast": 0,
...
For this data object, there’s only a few fields, but the forecast flag in particular is key. If it’s set to 0, then that was the current capacity and demand of the grid at the time taken. If it’s set to 1, then it’s a prediction of the demand. Once that interval has passed, then the actual values are recorded to JSON.
Here’s a breakdown of the various fields:capacity: Current power being generated (in MW)demand: Current power load being consumed (in MW)forecast: If set to 0, capacity and demand are actual values. If set to 1, capacity and demand are predictions of the values at that interval.dstFlag: Presumably this is whether or not Daylight Savings Time is in effect.interval: This is the specific minute interval (in 5 minute blocks) of when the data was taken or forecasted. (0-55)hourEnding: This is the hour in which the data was taken or forecasted. It’s formatted in military time, so 13 would be 1PM.
Unfortunately, I don’t know enough jq to format a proper query, so I just grep for it out of the JSON and then use jq to make it look nice.
$ curl -s -k https://www.ercot.com/api/1/services/read/dashboards/todays-outlook.json | jq . | grep -B5 \"hourEnding\"\:\ 17 | grep -A1 -B4 \"interval\":\ 55
      "capacity": 50026,
      "demand": 40643,
      "forecast": 1,
      "dstFlag": 0,
      "interval": 55,
      "hourEnding": 17
This query was for 5:55PM based on interval and hourEnding fields. It’s a prediction because it’s not 5:55PM and forecast = 1.
A few seconds later, we run the command again:
$ curl -s -k https://www.ercot.com/api/1/services/read/dashboards/todays-outlook.json | jq . | grep -B5 \"hourEnding\"\:\ 17 | grep -A1 -B4 \"interval\":\ 55
      "capacity": 49044,
      "demand": 41138,
      "forecast": 0,
      "dstFlag": 0,
      "interval": 55,
      "hourEnding": 17
Now that forecast is 0, this means that at 5:55PM today, this is what the grid’s current capacity and demand were at.
What now?
Now that you know the endpoints and the data presented by each, you can do what you want with them. You could download the json files and graph them to see how the grid did in the prior 24 hours (assuming you download them at 11:59PM each night. The outlook file isn’t all that interesting as it’s a forecast and a history of the state of the grid. The daily-prc file could be used to set up Nagios alerts, if the grid is on the verge of collapse again, you might want to know about it beforehand.
Either way, don’t be a dick, pull the files once every few minutes or so. We don’t want to DDOS them in time of crisis, goodness knows they have a hard enough time keeping the lights on as it is. 😀
Happy Hacking!
FIRESTORM_v1 (with thanks to ChrisS for jq help!)